
Ethereum (ETH) is facing a severe test of investor confidence as a perfect storm of negative catalysts drives its price down sharply. Over the past week, ETH has shed nearly 18% of its value, breaching key support levels and igniting fears of a deeper correction.
The downturn comes as institutional demand, once seen as a bedrock of support, appears to be wavering. This technical and fundamental weakness has analysts closely watching a critical price floor, with some predicting a potential slide toward $2,400.
The Institutional Chill: A Six-Day ETF Outflow Streak
A primary driver of the recent sell-off is a significant shift in institutional sentiment. Data reveals that U.S. spot Ethereum Exchange-Traded Funds (ETFs) have recorded six consecutive days of net outflows, bleeding a combined $630 million.
This persistent exodus of capital from regulated investment products is more than a statistic; it’s a powerful signal. Continuous ETF outflows suggest large investors are reducing exposure, which dampens overall market appetite and can create a self-fulfilling cycle of selling pressure.
The Technical Breakdown: A Cluster of Bearish Signals
The price chart tells an equally concerning story, with multiple technical indicators flashing red and pointing to further downside risk.
-
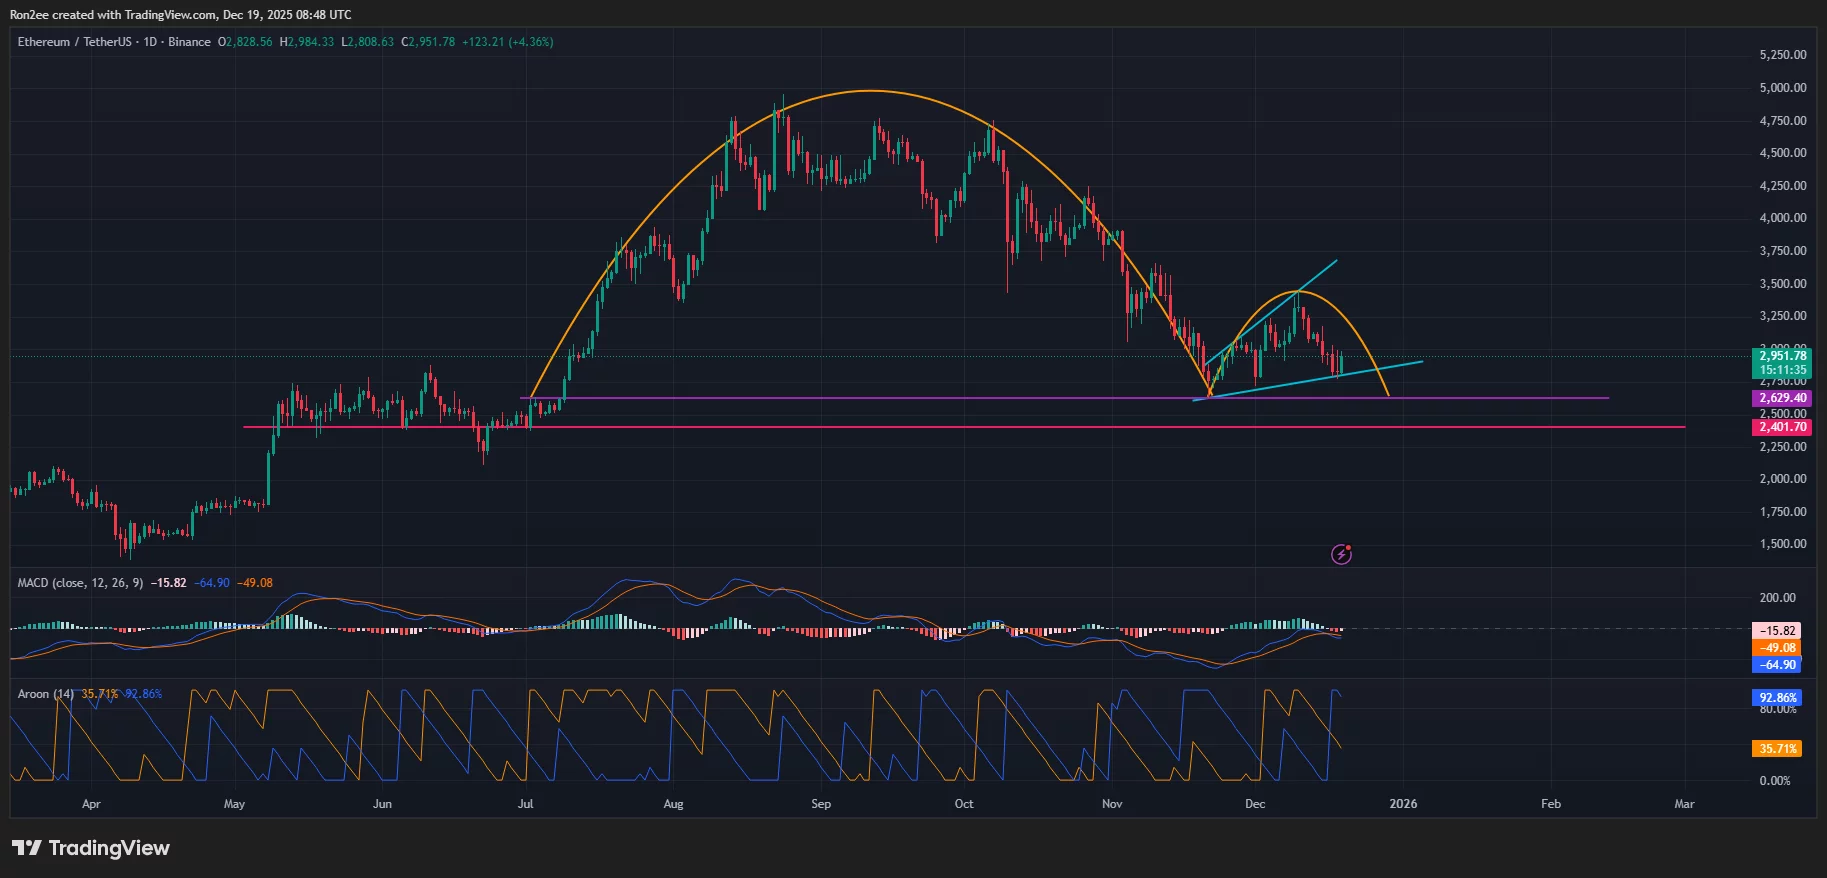
The Ascending Broadening Wedge Break: For over a month, ETH traded within an Ascending Broadening Wedge pattern—a formation that often resolves with a bearish breakdown. This breakdown has now occurred, signaling a potential trend reversal from up to down.
-
The Larger “Inverse Cup and Handle”: This breakdown is taking place within a much larger, more ominous pattern known as an Inverse Cup and Handle. The current price is testing the $2,629 “neckline” of this multi-month structure. A decisive break below this level would confirm the larger bearish thesis and open the door to significantly lower prices.
-
Indicator Confirmation: Momentum indicators align with the bearish price action. The Moving Average Convergence Divergence (MACD) is trending downward, showing bearish momentum is intact. Furthermore, the Aroon Indicator shows the Aroon Down line at a dominant 92.86%, strongly confirming that downward momentum is in control of the market.
External Pressures: Macro Headwinds and Leverage Unwind
The bearish setup is compounded by challenging external factors:
-
Macroeconomic Shifts: A recently more hawkish tone from the U.S. Federal Reserve, suggesting fewer interest rate cuts in 2026, alongside a surprise rate hike from the Bank of Japan, has made risk assets like cryptocurrencies less attractive to investors.
-
Derivatives Market Carnage: The sharp price drop has triggered a massive liquidation of leveraged positions. In just the last 24 hours, over $158 million in ETH futures positions were liquidated. These forced sales add immediate and intense downward pressure to the spot market.
Ethereum Price Prediction: The Path Ahead
The immediate future for ETH hinges on its ability to defend a key level.
-
Critical Support at $2,629: The $2,629 neckline of the Inverse Cup and Handle is the most important level to watch. A sustained daily close below this support would be a strongly bearish confirmation.
-
Next Major Target: $2,400: If $2,629 fails to hold, the next significant support zone is $2,400. This level has acted as a reliable floor throughout 2025, and a break below it could trigger an even steeper decline.
In summary, Ethereum is at a precarious juncture. The combination of fleeing institutional capital, a cluster of bearish technical breakdowns, and tough macroeconomic conditions has shifted the balance of power decisively to the sellers. While volatility is a hallmark of crypto markets, the current evidence suggests the path of least resistance for ETH is lower, with the $2,400 level emerging as the next major battleground for bulls and bears.