The Chainlink price has found itself at a decisive juncture, testing a crucial support level after a grueling four-week downtrend. Currently trading around $12, LINK has shed over 55% from its yearly peak, leaving investors questioning whether this is a bottoming pattern or a pause before further decline.
This price action presents a fascinating conflict between concerning technical indicators and a number of fundamentally bullish on-chain and macroeconomic developments. The battle between these forces will likely determine LINK’s trajectory for the coming weeks.
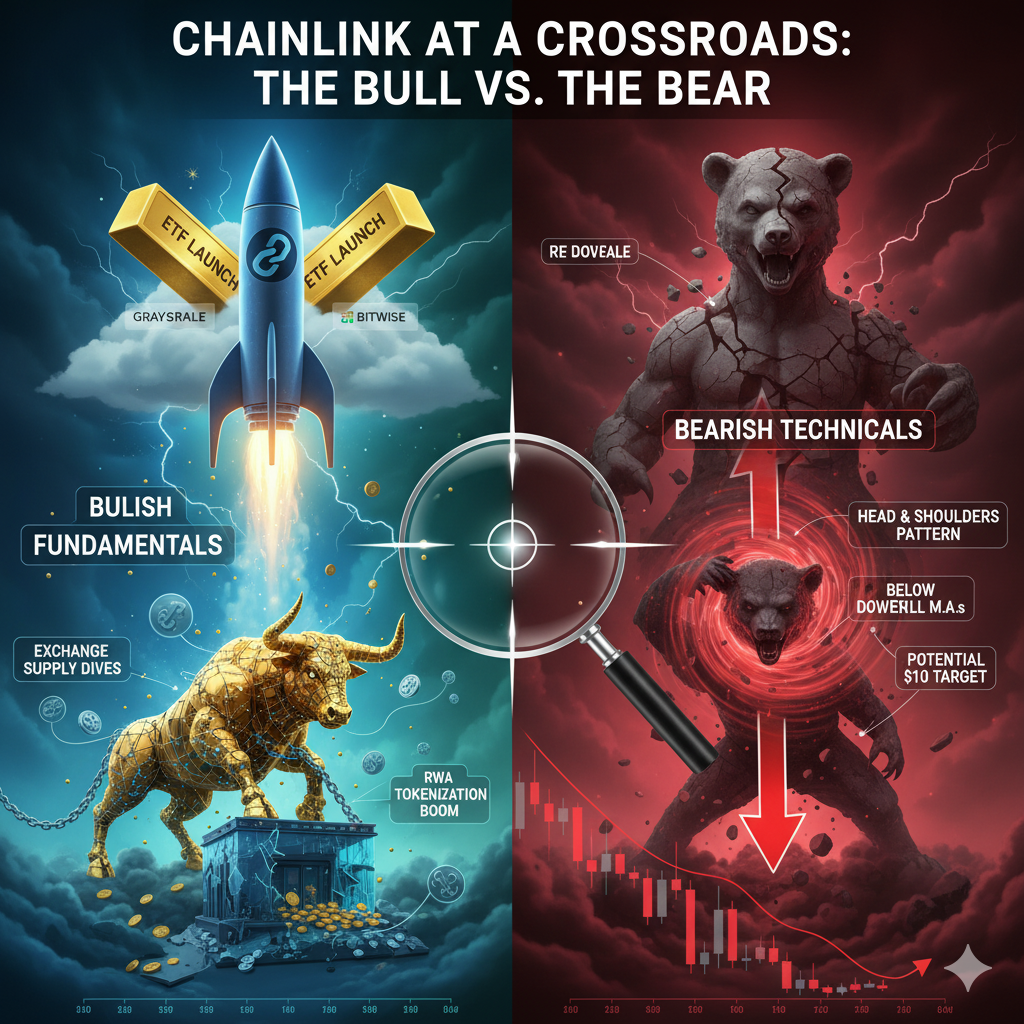
The Bullish Fundamentals: A Case of Hidden Strength
Beneath the surface of the falling price, several key metrics suggest underlying strength and long-term investor confidence.
-
Exchange Supply Plummets: Data from Nansen reveals a dramatic exodus of LINK tokens from exchanges. The supply has plummeted to 213 million, down significantly from over 300 million just a month prior. This drop in exchange supply is a classically bullish signal, indicating that investors are moving their holdings into cold storage for long-term keeping, not preparing for a sell-off.
-
Strategic Reserves Grow: The Chainlink Reserves, funded by the network’s own on-chain and off-chain fees, continue to swell. They now hold over 884,000 LINK (valued at ~$11 million), with a substantial addition of 81,285 tokens as recently as November 20th. This demonstrates the protocol’s healthy and growing utility.
-
The ETF Catalyst Looms: The crypto market is buzzing with anticipation for the potential launch of the Grayscale Chainlink ETF (GLNK). Following a nod from Bloomberg’s senior ETF analyst, Eric Balchunas, many expect the fund to debut as soon as next week. The simultaneous appearance of the Bitwise Chainlink ETF on the DTCC database adds fuel to this fire, potentially unlocking a wave of new, institutional demand.
-
RWA Tailwinds: Chainlink remains the cornerstone oracle for the booming Real-World Asset (RWA) tokenization sector. With the total value locked in RWA projects climbing to over $35.6 billion, Chainlink’s fundamental utility and demand base are expanding.
The Bearish Technicals: A Warning from the Charts
Despite the strong fundamentals, the technical picture for LINK price paints a more cautious short-term outlook.
-
Ominous Chart Pattern: The weekly chart has formed a clear head-and-shoulders pattern, one of the most recognized bearish reversal formations in technical analysis. The price is currently hovering at the critical “neckline” support; a decisive break below this level could trigger a significant sell-off.
-
Indicator Confirmation: The bearish sentiment is reinforced by key indicators. The Relative Strength Index (RSI) is bearish yet not in oversold territory, suggesting there may be more room to fall. Furthermore, the price remains below all key moving averages and is being shadowed by a bearish Supertrend indicator.
Chainlink Price Prediction: The Path Forward
The LINK price is caught in a tug-of-war. The path of least resistance in the short term appears bearish, guided by the ominous technical setup. A breakdown below the current neckline support could open the door for a move toward the $10 psychological level.
However, for long-term investors, the fundamental story remains compelling. Any significant drop could be viewed as a buying opportunity ahead of a potential ETF-led rally.
The key level to watch for a bullish invalidation is $17.83, the yearly high from May. A reclaim of this level would shatter the bearish pattern and signal a strong return of buyer momentum. Until then, caution is advised as the market digests these conflicting signals.