The cryptocurrency market holds its breath as Bitcoin price action enters a period of intense compression. The flagship digital asset is coiling tightly within a classic technical analysis formation: a symmetrical triangle pattern. This convergence of lower highs and higher lows signals a battle between bulls and bears, with volatility squeezed to a simmer. All signs point to a decisive breakout being just around the corner.
The Anatomy of the Bitcoin Coil
On the charts, BTC/USDT is painting a textbook picture. The pattern is defined by a descending upper trendline (resistance) and an ascending lower trendline (dynamic support). Each bounce off these boundaries has been precise, demonstrating that the market is in a state of equilibrium. This consolidation phase is not a sign of weakness but a gathering of energy, where liquidity pools build on both sides, priming the market for a powerful directional move.
Key Technical Confluences Building the Case
While the breakout direction remains undefined until price exits the pattern, several technical factors are aligning to form a compelling narrative:
-
Resilient Dynamic Support: The lower ascending trendline has been tested and respected multiple times. Each successful hold indicates strong buyer interest absorbing selling pressure, reinforcing this level as a critical floor.
-
The Golden Ratio’s Role: Adding significant weight to the bullish defense is the confluence of this dynamic support with the key 0.618 Fibonacci retracement level. In technical analysis, this “golden ratio” zone is a high-probability area for trend reversals or continuations. Its alignment with the triangle’s support creates a powerful technical base.
-
The Apex Approacheth: The most critical factor is time. As Bitcoin price winds towards the triangle apex—the point where the two trendlines converge—the coiling effect intensifies. This compression inherently leads to volatility expansion. The closer we get to the apex, the higher the probability of an imminent, sustained breakout.
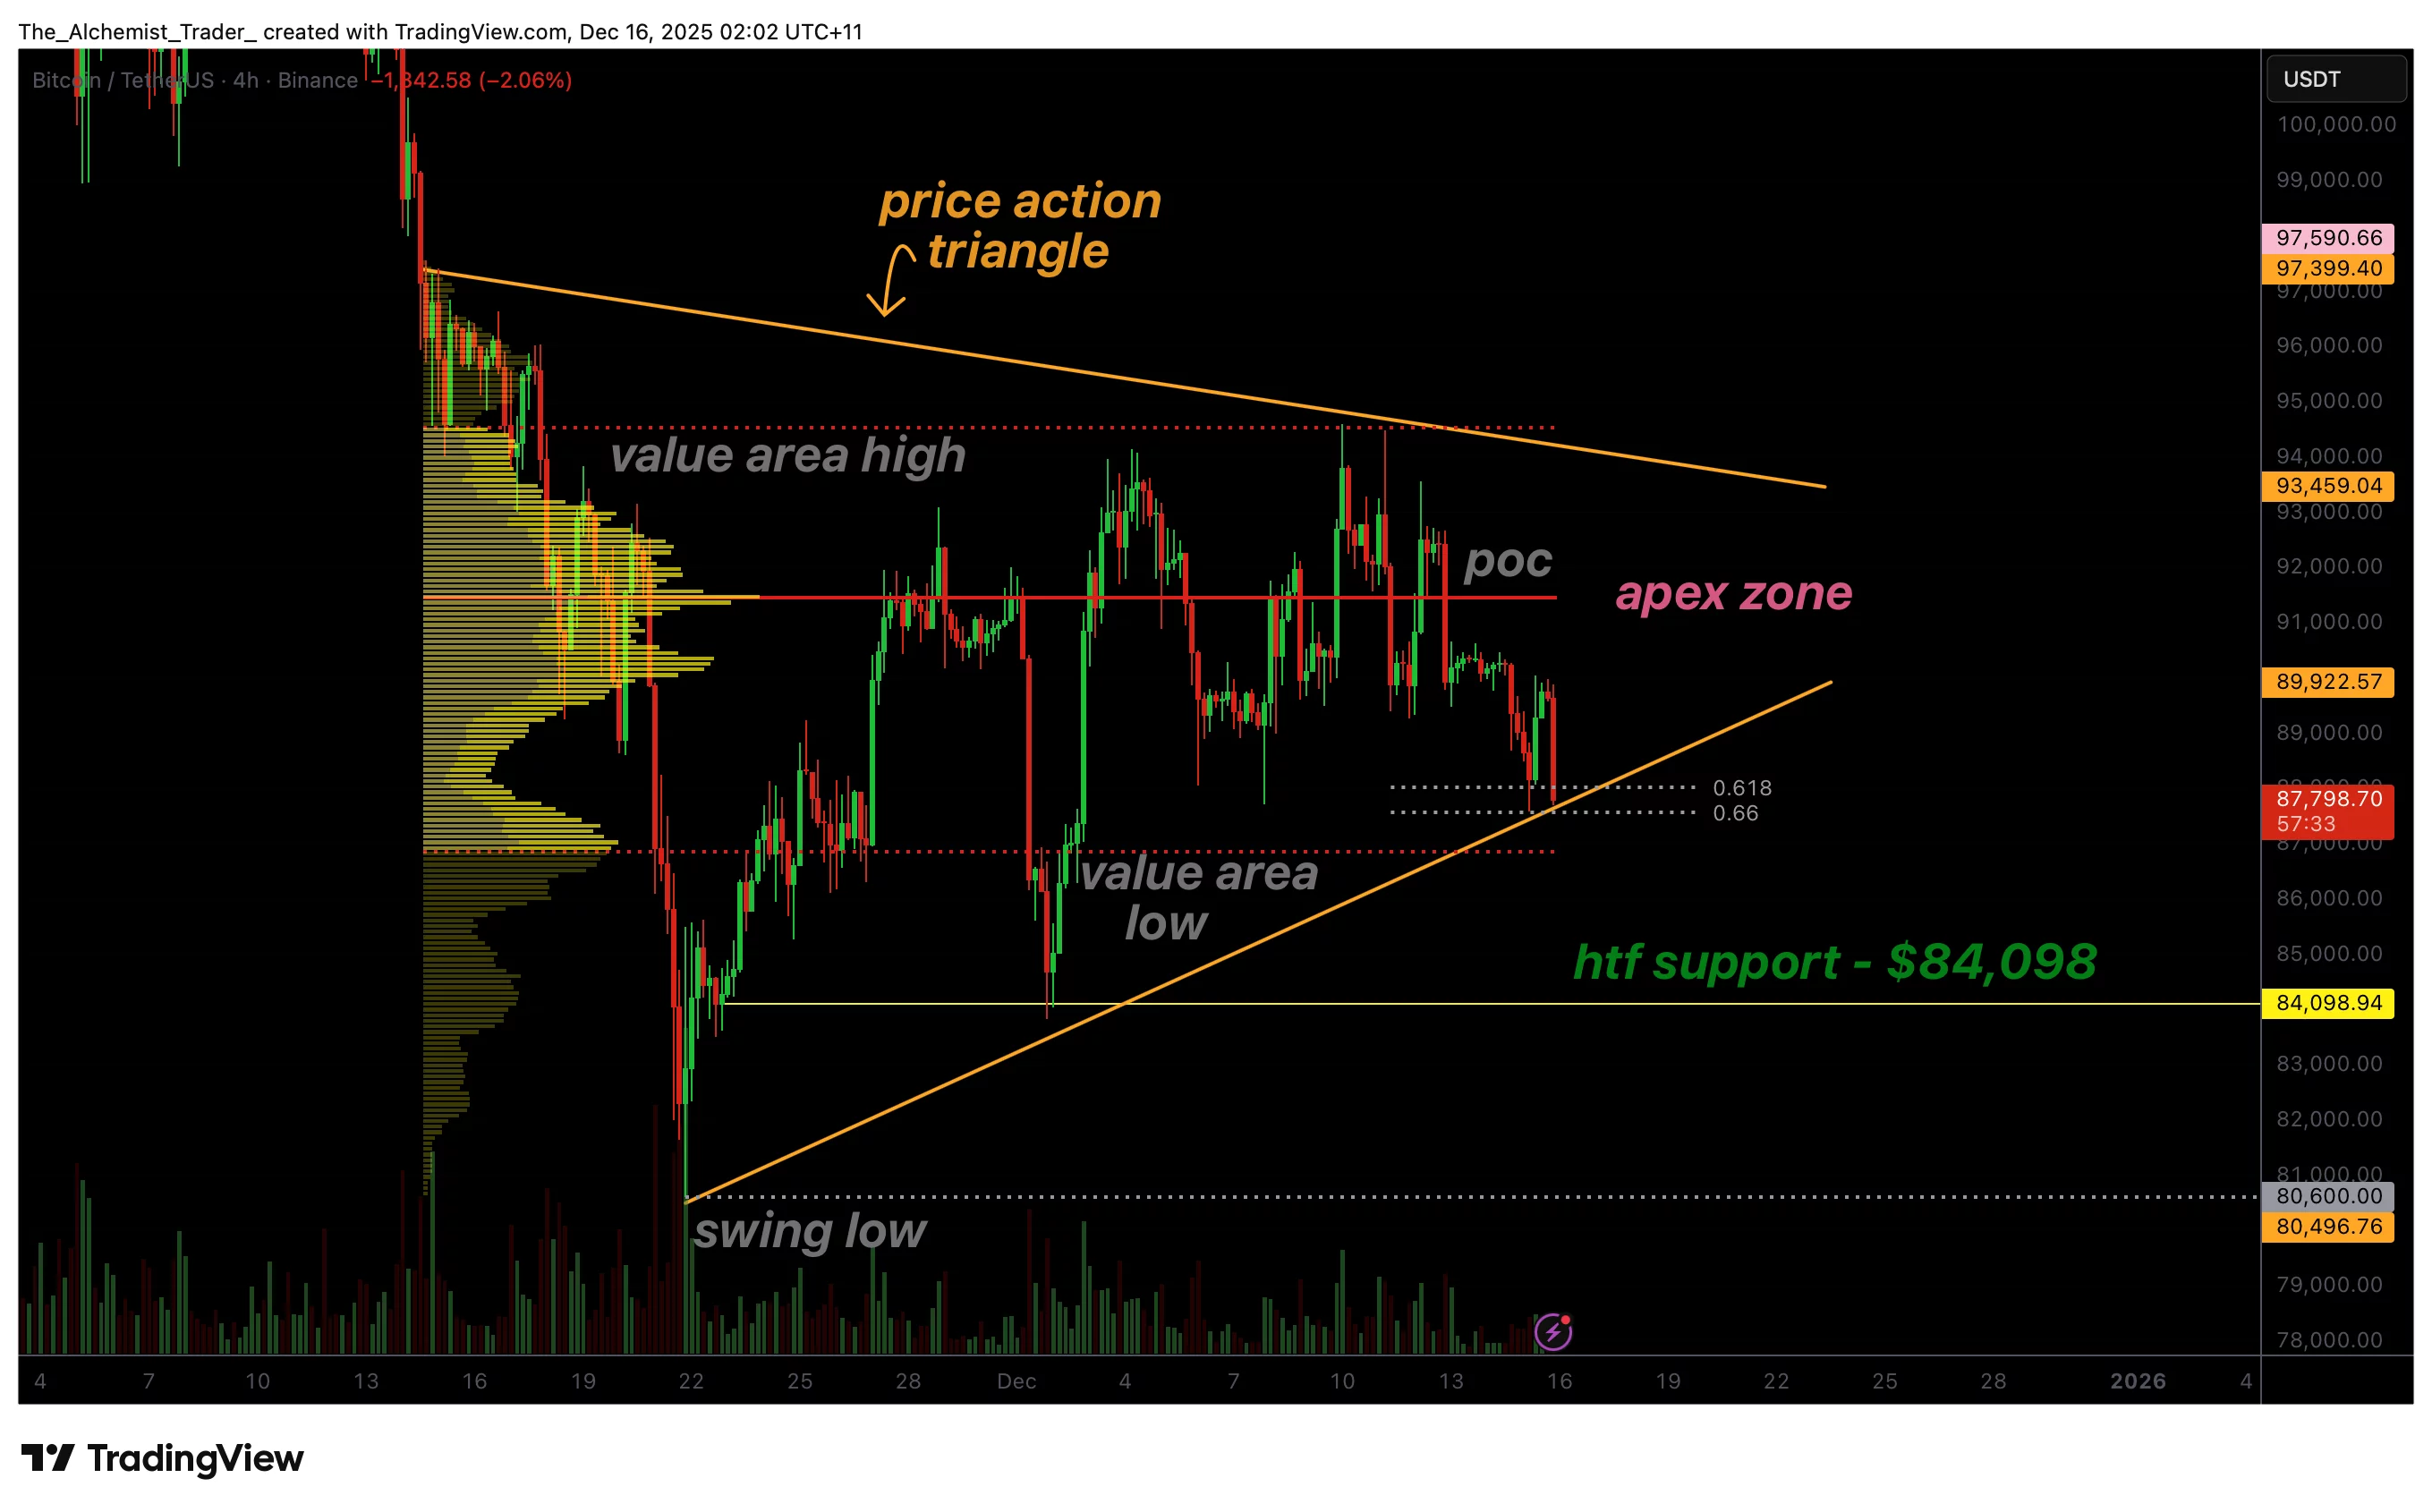
BTCUSDT (4H) Chart, Source: TradingView
What a Breakout Could Mean for Bitcoin’s Trajectory
The market’s next major move hinges on which boundary of the triangle pattern gives way.
-
Bullish Breakout Scenario: A decisive 4-hour or daily candle close above the upper descending trendline, especially on significant volume, would signal that bulls have absorbed all overhead selling pressure. This could trigger an impulsive rally, with initial targets often projected by measuring the height of the triangle’s base.
-
Bearish Breakdown Scenario: Conversely, a sustained break and close below the ascending support line would invalidate the current bullish confluence. This could accelerate selling, with the market looking towards the next major support zones, potentially leading to a deeper correction.
The Trader’s Playbook: Preparation Over Prediction
In such a tense technical setup, discipline is paramount. The current strategy should not be to blindly guess the direction but to prepare for confirmation.
-
-
-
Wait for Confirmation: The safest play is to patiently wait for a strong candle close outside the triangle boundaries. False breakouts (wick breaks) are common near the apex; confirmation is key.
-
Volume is the Validator: A genuine breakout should be accompanied by a noticeable spike in trading volume. This validates the move’s strength and increases its reliability.
-
Manage Risk: However the breakout unfolds, it will likely bring heightened volatility. Ensuring appropriate position sizing and stop-loss levels is crucial to navigate the impending expansion safely.
-
Conclusion: The Calm Before the Storm
Bitcoin is in a classic standoff, its price compressed in a triangle pattern that cannot hold forever. The repeated tests of dynamic support, bolstered by Fibonacci confluence, show a market building tension. While macro factors and news can act as a catalyst, the chart structure itself is screaming for a resolution.
For investors and traders, this is not a time for impulsive action, but for vigilant preparation. The great Bitcoin squeeze is nearing its end, and the resulting breakout will set the tone for the next major leg in this market cycle. Watch the apex, watch the volume, and be ready to react to the market’s decisive next move.
-